🏆 Free Crypto & Economic Report Out Now!
📈 TIA Gann Swing Indicator
🔐 Crypto Storage LEDGER
Subscribe to Michael’s Channel
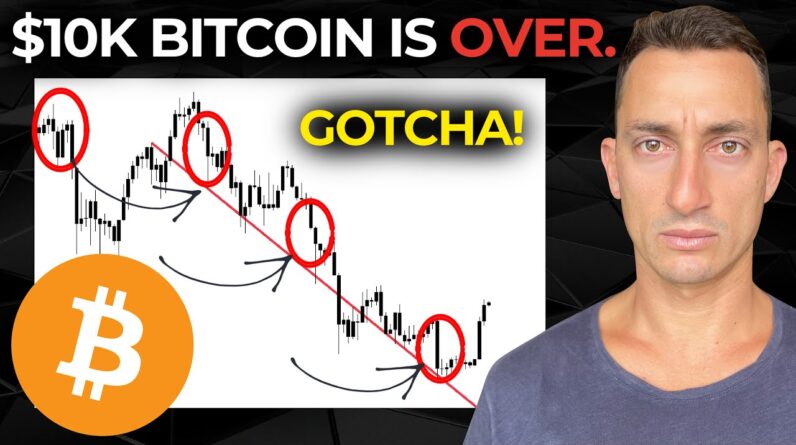
Bitcoin has been pumping uncontrollably for the last 2 weeks. Is the Bitcoin and Crypto bull market back on? Let’s discuss the Wyckoff “Gotcha” and “Lock-Out” candles, and what happens next for Bitcoin.
UP TO $48,755 FREE! Crypto Exchanges
🥇 ByBit Free $30,030 + 0% Maker Fees (NO-KYC)
🥈 Bitget Free $8,725 (US + Global Users NO-KYC)
🥉 OKX Bonuses $10,000 (US + Global Users No-KYC)
🇦🇺 Swyftx, Best Australian Crypto Exchange
▶ My Official Socials ◀
YouTube
Instagram
Twitter
▶ My Must-Have Crypto Resources ◀
Education – TIA PREMIUM MEMBERS, Trading Courses & Exclusive Community
Charting – TRADINGVIEW ($30 Off)
Storage – LEDGER
Tax – KOINLY (20% Off)
Trading – TIA GANN SWING INDICATOR
This video is for entertainment purposes only. It is not financial advice and is not an endorsement of any provider, product or service. All trading involves risk. Links above include affiliate commission or referrals. I’m part of an affiliate network and I receive compensation from partnering websites. #crypto #bitcoin #cryptonews
Bitcoins on the move again today hitting Twenty three thousand dollars so what we Want to find out is is this move Sustainable and is there more Information to allow us to understand if The low is in on bitcoin I want to bring Up some analysis that helped us identify The top of the market we've discussed This before so make sure you are Subscribed with the Bell notification Icon on like the content up so you can Learn how to identify when the market is Flipping from the Bears to the Bulls and The Bulls to the Bears on a macro scale Swinging the probabilities in your favor Just like what we do with our members at Tia so with that said let's dive in to Today's chart now we've got some Updating to do here and the main thing We're focusing on is the Wyckoff Analysis in particular the gotcha bars That's new to you I'll explain what that Is and this helped us identify the top Of the market in April of 2021 of course The market did Mrs Bitcoin did proceed To take that 65 000 top out six months Later but identifying that that was Potentially the Peak at the time saved Myself and a lot of you guys and members Plenty Of Heartache in that collapse so Let's take a look at that first before We start to dive in to the Wyckoff Analysis right now and update where we Are looking at some of the Wyckoff
Gotcha bars and how the market is Actually flipping those from bearishness To bullishness and so this is the the Main one that I bring up here back in April it's on the channel it's all out There for you guys to see back in the Past April 24 looking at a count of Consecutive days down which then helped Us identify the gotcha bars as well Looking specifically at volume and the Size of the bar itself so this is the Type of of analysis that we're looking For moving forward into today's market And this particular bar that comes up Towards end of moves to basically catch People out especially as the market is So hyped up at these Peaks then you get These move to the downside and basically Just traps a whole lot of people Essentially a gotcha buyer is you've Been buying in and now the smart money Has got you you're trapped in these Positions at a loss And you're basically going to keep Holding them because that's what happens To new money and so what we were Identifying at that point in time was This particular bar here this is on the 18th of April and that Peak was sixty Thousand four hundred dollars and so What was happening through May was the Over exuberance of calls to eighty Thousand dollars hundred thousand dollar Bitcoin a hundred and fifty thousand
Dollars across all of your favorite news Channels in cryptocurrency trying to Hype up the market to get it going again But you could then see that this just Did not go anywhere and it started to Round out as another lower top in the Market which of course we know is Extremely weak and so just going back to This bar so we can move forward to have A look at how this is such an important Signal now that we are overcoming These Bars to flip from what is essentially a Very very bearish bar on its own to Something a little more bullish and We've seen that also through through the Bear market so we've got those as Examples as well so essentially what's Happened like we explained is people Were buying They're getting sucked into the market Especially with all of the hype then the Market crashes and takes out a lot of Essentially stops and lower prices and Then you're caught in a loss and so what We're now looking for to the upside is If the markets or the buying activity All the investors the Traders anyone Buying up the particular asset in this Case Bitcoin if they can overcome the Top of that bar not the top of the move Or the swing but just the top of the Particular bar and how we identify these Bars are generally they are much larger In size you can see that this bar was
Close on with just over nine thousand Dollars and that's not a typical bar Throughout this period going all the way Back to February had some big bars back There or if you want to call them Candles go for your go for your life but I tend to use bars a lot but for the Sake of the viewers that Everyone likes To use candles essentially this was out Of the ordinary a huge candle very large Volume and a wick down trying to get Back above to close the gap again to the High the other thing to note is the Volume the volume was very extreme so You can see that this particular volume Had not been hit since that February Drop in the market so it's unusually Large volume as well so that's one of The reasons why we identify that as a Gotcha bar to say that this is one of Those times where the dumb money has now Been caught out and they will probably Continue to hold their positions and Hope that the market goes back up so It's a time where you need to be Extremely cautious not to be on the Wrong side of the market that could be Down or up either way just depends on The trend of course And not to be fomoing in buying up as Much as possible in the hopes that the Market goes up the confirmation is if The market can at least get back to the Top of that bar there and hopefully
Exceed it by a little bit there so that Could at least hold the market up for a Longer period of time and then not end Up with another extreme collapse so it Needs to at least overcome the buying of That day essentially the investors of That day have said that this is an Important day the prices are very Important so now that we've got that Understood we fast forward to a few more Examples and have a look at how we're Now flipping from the Bears to the the Bulls as well So in the bear Market we do have another Example of another gotcha bar people Were buying this dip here in January Market moves up and then eventually it Rolls over and slams down high volume Big ranging bar compared to what you Could see in the past going back to this December crash so again it's the same Analysis it's looking at the same type Of structure of that that candle or bar Extreme volume you can see here that That volume is Extreme very very high Nothing compares to it going all the way Back to that may crash itself so now We've got another gotcha bar but in this Case you can see the market load the Following day started to climb back and Then came through and overtook the top Of that bar so we can refer to this Particular candle or bar as a lockout so There might be other names to it but
Essentially it's locking out the people Who were hopeful of another drop back Down to buy up the dip and then they got To rush in and buy up ideally want to See some high volume but overall it's Been very high volume throughout entire Period And so what that can do is Potentially switch flip the market from Extreme bearishness to now bullishness And at least start to form some sort of Base and that's exactly what we saw Through January February March and then Into April as it started to climb down Into that final collapse into May so Although this didn't Flip the entire macro structure from Bearish to bullish and go on a new All-time high price it did hold the Market up for four months so quite Significant in an overall bear Trend and We now know from history that this was An extreme bear Market it was basically The bear Market of the cycle the cycle Ended so if the market can get back Above What we identify as Wyckoff bars Basically the gotcha bars then we know That there is the possibility of the Market being held up for a good amount Of time and as it continues to climb and Break some of the other got your bars on The way down then that starts to put More emphasis on the trend flipping Along with all of the other signals that
We talk about on the channel which you Haven't already you know the deal the Drill down below is to like subscribe And of course Bell notification icon leave a comment Anything goes a long way to the channel So that is the the drop down the gotcha Bars and then an example of how you Cannot get caught out here basically Buying those Peaks and just waiting for That confirmation sure in this case you Had the the lockout here where the Market just scoots on up but that gives You a signal or identifies that you're Going to see some more consolidation or At least some higher prices as well and That's exactly what happened then of Course that led to another gotcha bar And that's where all of these yellow Lines come in and what we're about to Discuss next so the next gotcha bar on The way down also broke through the Major 50 level so that's our Gan Analysis along with the Wyckoff analysis So we had a big breakdown bar here the Big volume and as you can see the market Never recovered never got back to thirty Four thousand dollars so that's going to Be an extremely strong resistance level A key level on the way back up should The market should Bitcoin slice through That on the way up and remain above it It's going to be very strong for the Bulls if it gets hit and resistance is
Formed it's not going to be any surprise To people but if we get the opposite and Of course it breaks above that's going To be nice and strong for the Bulls so We've got one bar to overcome here the Top there is around 34 200 the next one Down is a 26 869 so call it twenty six Thousand nine hundred and we've had These on the chart the whole way down And now it's about time to clear off Some of them as the market can begins to Work its way higher now here are some of The exciting ones that we can start to Clear off we've got the 23 200 which Also lined up with our over balance in Price that we talked about on the Channel uh just in the last few days so I'll leave a link to these videos at the End of this video so you can stay up to Date with that in case you missed out on That content there the next one's down This is a level here around 20 600 700 Another Wyckoff bullish flip there and Then you'll have these on all different Time frames at lower prices so this can Be used on different time frames but Just make sure the flip that you're Looking at is on the time frame that You're referring to a flip on a one hour Or a four hour is not going to flip the Macro Trend to a bullish flip on the Weekly you've got to be looking at on Daily to daily or weekly to weekly and Of course hourly to Ali so what we
Currently see is the market breaking the Price ranges of these bars so Essentially it is clearing out the dead Wood of what happened on those Particular days that trapped buyers or Investors into the market you can see The top there is 23.2 we have now Overcome the top of that particular bar Just by a few bucks and we're trying to Attempt that again but the main ones we Can really get rid of here we've got the Multi-hourly swing the step two this was To climb our way out of the low we have The Wyclef flip in these two bars here And we also had another one in a shorter Time frame that's what we're getting rid Of that and now we also have this one Here the Wi-Fi bullish flip at the top Here of twenty thousand seven hundred it Formed and Consolidated above just like We talked about in this particular video Here just a few days ago and we've got That so we can now clear that off and The main number here that we've been Watching since the June low or somewhere Around July of 2022 was 20 700 so you Can see how important this level has Played to the market through this entire Bear Market I don't think we've cleared That just yet if we get past 25 200 We're probably well on our way to saying Goodbye to the the sub 20 000s but it's Not there just yet even if we do break Above it could be several months that
Maybe the hype wears off and we start to See Bitcoin Fade Into the second half of The year but nonetheless we've started To break through a lot of those Wyckoff Bars we've already broken through two of Them there and uh you know a definite Two one right here and one right here so It's looking rather bullish especially Along with the downtrend getting taken Out we looked at the log downtrend that Was yesterday we've passed the linear Downtrend as well we've got a lot of Volume coming into this game which is Why I continue to say that 10K is Extremely unlikely with the more bullish Signs that we have leading into this First quarter of 2023 so now the main Things that remain on the chart are the Monthly swing top which is at 25 200 the Wyckoff flip bar here which is the 26 900 just for the ease of the chart I'm Going to put too many lines on there so That's the level there in that mid 20s And then up around 34 000 into 34 000 And a half which is our fifty percent Available level level and also another Wipe off bullish flip so they're going To be two key areas on the way back up Maybe Bitcoin hits those on this current Run maybe it needs a little bit more Time to consolidate before pushing again That's yet to be decided but the main Thing is that we've now seen more Bullish signs for this particular run-up
Being the start Potentially of a new bull market rather Than a bear Market rally which a lot of People are still calling for so with the Market taking out these Wyckoff gotcha Bars basically overcoming those prices To the upside it's causing a lot of People to get liquidated you know exited Forcing them from the market the shorts Which is the the red bars here are the Highest they've been in this entire Period going all the way back to October There were some extreme shorts getting Liquidated through the the point where The market dumped but apart from that This is the highest period that we've Seen a lot of shorts get liquidated and That of course is fueling the balls as Well it doesn't mean that this has to be A bull market but there's just more Signs that of course people are trying To short this Market on the way up They're getting forced out and Potentially we're going to see bigger Moves ahead as a lot of these gotcha Bars get taken out you know the Structure of the market is changing There's a change of Behavior coming on Board another reason why we could see Higher prices Is that there's less Bitcoin on Exchanges so this is from glass nodes Here and we can see that Bitcoin has Been coming off exchanges which of
Course if there's less Supply then it's Much easier to manipulate the market and Push the market around so if that's the Case then sure this is part of the Reason for the Bitcoin prices going up Along with that the fear and greed there Is just far less fear in the market Something that we also covered here Following it throughout this time Remember these things take time to Formulate and we're watching the Downtrend of the emotions Consolidate and then just recently break Out hit our 40 Point level and now get All the way into neutral for these sort Of signals shouldn't be forgotten it's Something that you can easily look at Daily and what we do here on a daily Basis with our members check out the Link in the top of the video description For our free newsletter as well if you Haven't looked at that already the link Is in the top of that video description Absolutely free it comes out once every Two weeks and it's something that we Follow over there because watching the Market sentiment is extremely important To identifying what is going on in the Market along with our macro market Analysis and this of course is something That we've continued to cover it doesn't Always happen that next day but as long As you stay on top of it and keep Watching what's going on eventually you
Can see that these Trends do break and Start to form a new trend now with Market heating up we have a couple of Major levels that we're looking at Further ahead 25k level the 27k level And of course that 34k level so I'm not Sure if it's going to get there straight Away but if you have those on your Charts just like we do with all of our Other analysis we can keep up to date With it and not forget what's going on In the market what's happened in the Past so that we can continue to forecast The future thanks again guys like Subscribe Bell notification icon videos Are popping up here on your left hand Side this is my last video from Dubai so Thanks very much for joining me over Here I'll be back in Australia at the Next video in a few days time so don't Go anywhere things are looking beautiful For 2023 it's your home of macro Cycles In crypto stock markets and of course Real estate see you at the next one Until then peace out


