🏆 Free Crypto & Economic Report Emailed To You!
📈 TIA Gann Swing Indicator
🔐 Crypto Storage LEDGER
▶ Subscribe to the channel for more macro market analysis on Bitcoin, Crypto, Stock Markets and Real Estate Cycles.
Subscribe to Michael’s Channel
UP TO $48,755 FREE! Crypto Exchanges
🥇 ByBit Free $30,030 + 0% Maker Fees (NO-KYC)
🥈 Bitget Free $8,725 (US + Global Users NO-KYC)
🥉 OKX Bonuses $10,000 (US + Global Users No-KYC)
🇦🇺 Swyftx, Best Australian Crypto Exchange
▶ My Official Socials ◀
YouTube
Instagram
Twitter
▶ My Must-Have Crypto Resources ◀
Education – TIA PREMIUM MEMBERS, Trading Courses & Exclusive Community
Charting – TRADINGVIEW ($30 Off)
Storage – LEDGER
Tax – KOINLY (20% Off)
Trading – TIA GANN SWING INDICATOR
This video is for entertainment purposes only. It is not financial advice and is not an endorsement of any provider, product or service. All trading involves risk. Links above include affiliate commission or referrals. I’m part of an affiliate network and I receive compensation from partnering websites. #crypto #bitcoin #cryptonews
Less than two weeks ago Bitcoin was Approaching 25 000 with many believing We were about to see 30 35 possibly even Forty thousand dollars on a mega pump From the lows in November of fifteen Thousand dollars what two short weeks in The market does to us so now we are Approaching at twenty one thousand Dollars with the sidelined bulls and Some of those Bears coming back into the Markets calling for a break of fifteen Thousand dollars so what the hell is Actually going on were we able to Forecast this to some degree and keep Ourselves safe from the fomo at the Peaks and hopefully safe from the fud as We start to creep lower in prices that's What we'll look at in today's video Where can this bottom come in is the Current bottom in trouble at fifteen Thousand dollars and what can we expect For the rest of February make sure You've liked the content subscribe to The channel Bell notification icon if I've missed anything you let me know in The comments section while you're down There check out the link in the top of The video description as we have our Free crypto and economic report coming Out this week less than 24 hours away at That link in the top of the video Description absolutely free sent to your Email inbox looking at real estate the Markets and stocks and commodities and
Of course cryptocurrency primarily Bitcoin all right last thing here is the Shout out to our Channel sponsors it's The old chill here for buy bit bitget And Swift X for the Aussies zero percent Spot fees on big get at the moment There's five days left if you want to Trade on those exchanges you do not have To use leverage so stay safe out there Use these links down below and get Trading with zero percent spot fees all Right let's dive straight back into the Charts and look at where we currently Sit on bitcoin and is this low in Trouble so we're now at twenty one Thousand seven hundred dollars just Eight days ago in this video right here Uh titled they are exiting Bitcoin and Waiting with cash ready for the next Move in February we were looking at a Potential top coming into the market for Many reasons around price and in Particular time we're measuring time in This video so I want to show you that And play that clip very quickly right Now so you can get a bit of an update From what we were looking at at that Time before the data has come in before The market actually made that move to The downside so check that out right now What we can estimate from this Especially after a low a significant Cycle low potentially the cycle low and Then a significant move out of that low
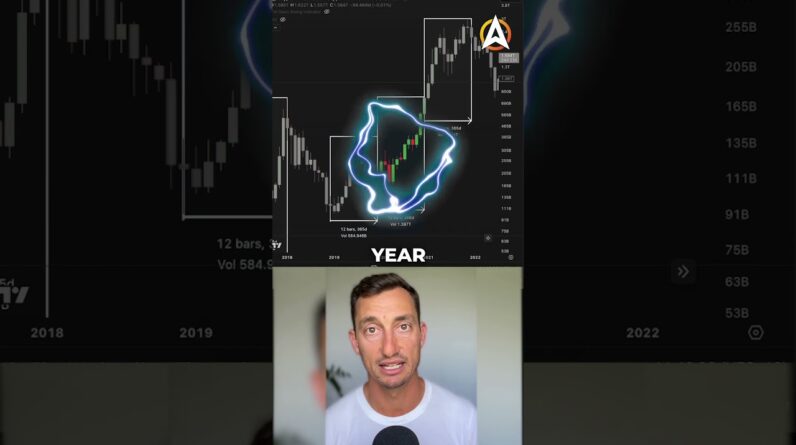
Being January what typically happens is February isn't a very strong month to The upside doesn't mean we won't get any Upside because of course we have had Some upside it's been a higher month Than the previous month in this case by One percent maybe we go that extra mile And take out that August top but that Might be getting a little bit too Excited for the month of February maybe We see that later in the first half of 2023 so as at the 5th of February when Bitcoin was still around 23 100 there Was the hopes that we were going to go Higher from that point we were looking At those time frames in particular two Of the major moves against the trend Throughout the bear Market we had the Move from January into that peak in March and that was nine weeks then we Went to the low in June to the peak in August that again was nine weeks and What we were looking at around that Period of the peak over eight days ago Now basically the fifth of February we Were looking at this particular move From the low in November being 10 bars Already so we had moved up slightly more Than what we had done previously and if We took it back to that previous low Where the FTX collapse happened Basically two weeks earlier that gave us An approximate 12 weeks up from that low Now of course the final load came in on
That 21st but essentially the move ended At FTX we just got a tiny bit lower from That point so whether you want to call It 10 weeks or 12 weeks the market was Up longer in time than the last two Moves to the upside so this is a Positive for the market so far it Doesn't mean that the low is 100 Confirmed but we're starting to see some Of those signs for that bull market Returning at least into that Transitional period where it is starting To get a little safer to be DCA into Bitcoin rather than these periods on the Way down so from that point we've now Reversed we've been down for several Days approximately from the top it's Been two weeks about 11 12 days and About a 12 move to the downside and so Pretty good timing for the exiting of Basically the smart money or any of the Money that was trying to push this Market up higher you could see that it Was topping out and the market basically Had to have at least a pause maybe a Correction and that's what we looked at In that video looking back over the History of Bitcoin looking at all of the The februaries that had come in from From previous cycles and trying to Determine what would happen in February So I'll just play you another Quick Clip About that basically what I was thinking Would be the case for February now that
We are now halfway through February what I can see from this is we're probably Due for a pause Or a correction in this rally so a bit Of a pullback and it seems like the Timing is about right for February to Have a top which we're currently on this Week maybe we go that little bit higher Maybe we don't and the idea here is that We potentially track sideways as a best Case for the Bulls or if you're looking To buy some more maybe we get that Pullback which we'll have a look in Future videos so like I said the way we Did that was looking at Price resistance But more importantly the time aspect now There was one other piece that we looked At for that video to determine whether The market was about to top out and if We needed a little bit more time to Consolidate before we're able to push Higher basically looking at where this Market could fall to and why and the Other piece was the fear and greed index And we were looking at this area at Around 60 being a resistance level for The fear and greed basically the greed Was just getting a little bit too hot For that period of time that doesn't Mean that we had to have a top but there Were just a lot of signals coming Together to say that maybe the Probabilities are not on our side for Higher prices on bitcoin from that Peak
We were really starting to push things To the very end and essentially if we're Trading that or trying to dollar cost Average into the market at better prices We don't want to put the probabilities Outside of our favor and so from that Point they were looking like they were Probably about to turn and so from that From that time we have turned over so Where can we see this low come in and do I think the low is in trouble this Fifteen thousand dollar BTC low that's What we want to answer in today's video So let's have a look at the fair and Grid index where could this come back to So remember that there's two important Things that we're looking at here three Overall one is price the second is time And then also we're looking at the third Thing here is that market sentiment Looking this fear and greed and so time So far has been probably one of the best In the potatoes here if we can put them All together even better so we had the Price coming in obviously those Resistance areas at around that 24 25 000 the time aspect started to basically Push towards that very end of the nine Bars we got to the ten and then it Started to roll over and then that greed Overall was just hitting those 60 levels Which we've seen in the past be pretty Good resistance areas for the market Especially if it's coming out of some
Extreme fear or essentially just fear on Its own so I've had that roll over so Let's have a look at where this could Pull back to and if we can put them all Together then we'll get an understanding Of where that price may be the most Important thing is where is the market Sentiment going to be and in what period Of time we get those two then we just Look at whatever the price is on that Day that's probably going to be it we Don't need to have that exact target Stay with me here we're looking at this Coming down the market fear and greed Index so what we've seen as well we've Seen some pretty good consolidation on The way up some stair stepping here from The tens to the 20s into the 30s so Probably know where I'm going to look at Here probably between this 30 and 40 Readings that's where we want to see the Fear and greed index consolidate too Should we get some spikes no problems But like you can see in these areas you Can see the market essentially starts to Consolidate it does Spike a little out And a little underneath but you start to Get that consolidation of the market Sentiment so that's what we're looking For here somewhere around this 30 to 40 No dramas if it drops to around that 20 Area as well so that's the market fear And greed index now in terms of timing We've been up for 10 weeks what can we
Look for next well in that particular Video right here like we saw on the on The channel here where everyone's wrong We're looking at the timing here this Never ends well we also looked at the Fear and greed as well basically Probably looking at somewhere around Late February or early March for this Move to end of course it could end Earlier but we just have to have a bit Of a guide here and look at all these Factors coming together at the same time So we've now been down for about two Weeks we throw this onto a daily we'll Get a better measure of the actual days Down so that's eight bars eight days to That particular low and then we come to This low here uh that's the better Reading here around 11. so we were up For about 70 to 73 days from the low to The high so if we go around half because We use that 50 even on the time aspects About half of the time Uh 35 to 37 days is going to take us out To about early March of course this Could end early I'm not trying to say That it has to go to these levels but It's just a bit of a Target to have a Look at in terms of time just like we Would with price when we're looking at Previous support and resistance levels So now that we've got a bit of a Target In terms of time later in February maybe It ends a bit earlier and then
Tracks around sideways just buying that Time like it's done many many times Before you see these big moves and then It just goes sideways because it's just Catching up in terms of time then we can Look at the support and resistance Levels in price so let's look at this Chart here for the support and Resistance levels in price now there's Quite a few lines on the chart here but Essentially we just want to look at These horizontal levels this first one Here is coming in at around 20 000 and 700 that's been my key level for This entire period you guys have been Following let me know in the comments Down below throw us an emoji of the up Chart basically from this period the Consolidation we have that quick dump Down we were looking at twenty thousand Seven hundred as it's been a key level For the market to hold a support then Break down break above and then hit as Resistance on the way before going to 15K so 20 700 pretty good looking level Uh 50 level is This right here 19861 call it twenty Thousand dollars even for a nice round Number if you want to get technical use This number here past that point Eighteen thousand six hundred because It's been previous support levels and Through this area of September you can See the lows were around eighteen
Thousand one and we sort of dipped Closer to that 18 000 level as well so 18 to 18 and a half another great area That was previous support it broke Resisted and then broke through nice and Cleanly if we're to fall below eighteen Thousand dollars that is where we can Start to get those real big bearish hats Out for Bitcoin because if we drop back Into this level underneath these Previous support zones to me that means We are going to go back and get close to Testing that 15K if not break it so While we remain above these levels Potentially holding that twenty twenty One thousand dollars potentially holding Uh 18 18 and a half thousand dollars It's still looking pretty safe for Bitcoin obviously above this level 20 to 21 is the best below 20 into this 18 to 20K level not as good but still safe but If we drop below 18K sure get your Bear Hats out again start telling me that 10K Is back on that is where we start to Look much much weaker so those three Things that we are looking for as this Market begins to fall after they were All exiting Bitcoin with their cash Waiting for this Market to fall they're Not sure yet how much further this is Going to go down no one knows exactly Where it's going to go but you can bet Your bottom dollar that the smart money And the manipulators out there are
Testing each of these levels to the Downside you can see there was a bit of Consolidation here and right now they Are testing the supply of Bitcoin coming Into the market as the market Falls you Can see that we just had this low in the Last 24 hours at 21 300 so we got to That level which was a pretty good sign Here for some of you guys who are Commenting down below or also made might Wait for a small correction and go all In so yeah we did get that 21k pullback Which is a pretty good sign there as Well so I'm not going to get greedy in This in terms of what I'm going to do With the market but you can just see how The manipulation is playing out or Essentially the testing here you don't Want to be buying and going all in if There is still more Supply to come into Bitcoin which drops the price lower so What we'll end up seeing is some bounces And the swing chart start to Trend Upwards to let us know that the supplier Has potentially dried up and the demand Is coming back into the market but while The swing chart continues to put in Higher lower highs I should say and Lower lows that is telling us that there Is more Supply to come and we just have To wait that time out which was the Second thing we looked at being the time Aspect potentially later in February Maybe early in March for that that low
To come in or at least the move to end And the third thing we're looking at was The market sentiment should we see the Market sentiment drop into these levels Throughout this period of the market Trying to find this low and we start to Recover you know between sort of 30 and 40 odd in the fear and greed index That's probably going to give us that Signal that a lot of the time and the Price targets are coming together and We're just waiting now on the market Sentiment to catch up put all the pieces Together and then potentially we start To see the next reversal move from that Point so I hope you didn't get caught Off guard at these fomo areas of the Market at the peak and that you were Tuning into the channel for these Particular videos that we put out over a Week ago now while the market price was Up here at around 23 100 let me know in The comments section if you saw that Coming and the fomo that was in the Market at that time and I'll see you Guys at the next video like subscribe Bell notification icon and if you are Ready and waiting for our email Newsletter coming out this week thank You very much if you haven't signed up Already check out the link top of the Video description I'll see you guys at The next video Until Then peace out


