🏆 Free Crypto & Economic Report Emailed To You!
📈 TIA Gann Swing Indicator
🔐 Crypto Storage LEDGER
Has my macro outlook for Bitcoin and Crypto changed? No.
But I am anticipating a significant pullback will eventually happen. History proves this.
In today’s video, let’s discuss the massive traps and violent moves that smart money are setting up for the unsuspecting retail investor. This is a macro look at world economies and our global markets are all connected.
▶ Subscribe to the channel for more macro market analysis on Bitcoin, Crypto, Stock Markets and Real Estate Cycles.
Subscribe to Michael’s Channel
UP TO $48,755 FREE! Crypto Exchanges
🥇 ByBit Free $30,030 + 0% Maker Fees (NO-KYC)
🥈 Bitget Free $8,725 (US + Global Users NO-KYC)
🥉 OKX Bonuses $10,000 (US + Global Users No-KYC)
🇦🇺 Swyftx, Best Australian Crypto Exchange
▶ My Official Socials ◀
YouTube
Instagram
Twitter
▶ My Must-Have Crypto Resources ◀
Education – TIA PREMIUM MEMBERS, Trading Courses & Exclusive Community
Charting – TRADINGVIEW ($30 Off)
Storage – LEDGER
Tax – KOINLY (20% Off)
Trading – TIA GANN SWING INDICATOR
This video is for entertainment purposes only. It is not financial advice and is not an endorsement of any provider, product or service. All trading involves risk. Links above include affiliate commission or referrals. I’m part of an affiliate network and I receive compensation from partnering websites. #crypto #bitcoin #cryptonews
The US market fell two percent on the Back of the new narrative higher for Longer with interest rates with many Believing that this has not yet been Priced into the market in today's video Let's look at how the rest of the world Is reacting to this news and whether or Not we could be in for a catastrophe Further downside collapses past Significant cycle low points if you Haven't already like And subscribe to The content we have tons of macro Analysis to get through in today's video Looking at the objective Data before I Give you my opinion at the end of the Video if I can hold out till then from Your comments I'm seeing you finding a Ton of value from the video so thanks For the likes and subscribes and this Week we have our free crypto and Economic report coming out to you so get Along for that link is in the top of the Video description so let's first start With the shorter term before we blow This thing out into the longer term time Frames looking at where this Market has Dropped to now you'd note that we've Been following our fifty percent ranges From this bottom here in December to the Current top in February for the s p and This two percent drop has hit right on The 50 level almost near on the 3998 points yesterday closing at four Thousand and seven so this is coming
Back to a very good balancing point in The market another point to note where We currently sit in this macro side of The S P 500 the stock market the largest Economy in the world the us we've just Been hit with the rejection trap so That's what we're looking at here around The 4200 Point level that was pretty Evident on the chart and probably no Surprises for many that we would at Least test that level maybe break out Maybe get rejected of course it's a Rejection level as it's been used as Resistance many times over now to the Downside we've labeled our support area Here and around 3 800 points currently Sitting at four thousand so dead in the Middle here between 42 and 3 800 nothing To be overly concerned about at this Point past that level we are still Looking at 3 600 points as the second Support Zone before that final low at 3 500 points now the only time I could see Getting worried for the macro picture Here objectively speaking looking at the Data on the chart of course this is what The market has given us not my opinion Is if we're to break down from 3 500 Points that would mean investors are not Seeing the value in the s p past that 3 500 points but for now we are sitting Relatively safe here at 4 000 points With several support levels further down At 3 800 3600 and the low there at 3 500
Points earlier in February we looked at What the market could potentially give Us for the month of February and March And and we're expecting some sort of Pullback that's what we're looking at From the 5th of February just around These top levels as this is part of the Cycle So objectively speaking this is What the market has shown us over many Years of history that we could Potentially see a peak into a bit of a Trough now the big area is going to be Where does this trough come if we're Getting higher lows above 35 36 3800 Points that is going to be a good sign That it's setting us up for higher Prices in 2023 rather than the major Collapse that many are looking for That's just taking the information off The chart let's see how the rest of February and March goes but for now this In the short term is working towards the Plan and in the longer term is also Working towards the plan so this Essentially means in the short term we Can be bearish because Cycles do have Peaks and troughs in the macro sense Monthly to yearly we can still be macro Bullish believing that the 3 500 Point Level will hold on the a chart here and Eventually we'll see higher prices past 4 200 points in the s p which would Potentially lead the rest of risk assets To also increase in value as well in the
Short term the US's S P 500 may look Like it's struggling but around the Globe there have been many stock markets Putting in new all-time highs and not Just small insignificant countries major Players in the global economy if they're Not putting in new all-time highs They're putting in new 52-week highs and Typically when this happens this means The market is heading up recently we saw France the world's seventh largest Economy according to the IMF put in a New all-time high price on their stock Market they've even had a new highest Weekly close candle throughout its Entire history happened just last week We've been covering this on the channel Also looking at the UK and on Twitter it Is so if you're not following me on Twitter there is a link in the video Description I could squeeze in a quick Chill about that and with the UK hitting New all-time daily closes very Consistently now over the last couple of Weeks and also new weekly higher closes This is not the signs of a bear Market Or a collapse especially as it starts to Break into new all-time high prices as I Said this is just the objective data the Information that has come from the chart My opinion is reserved until the end of The video I'm just relaying what the Chart is giving to us right now so France is this world's seventh largest
Economy has put in a new all-time high Price on their stock market the UK the World's sixth largest economy has put in A new all-time high price on their stock Market Germany the world's fourth Largest economy is putting in 52-week Highs in their stock market if we put All of these together we have another Index called the stocks 600 it what is The Stock's 600 this covers Approximately 90 of all the free Floating market capitalization of the European stocks so there are about 17 Countries that make up the stock 600 With two-thirds of the entire index Being from four countries the UK like we Just looked at France and Germany and Rounding out that top four is Switzerland and this Market is also Putting him 52-week highs also breaking Past some significant swing tops it's Also found support at a macro 50 level Back in September and October of 2022 Which was the sofa cycle bottom for the S P 500 as well so many markets around The world were making lows at very Similar times however you're seeing the Europe European markets making better Gains in the US at this point in time so We'll come back to the stocks on the Channel make sure you are subscribed Like the content as well so we can stay Up to date with the world Mac reviews This is of course going to also help our
Crypto and Bitcoin trading and investing As once we start to see the cycle really Take off that's when we get a lot more Energy getting thrown back into the old Coins because people are interested in Gambling on all coins when the markets Are quite hot moving closer to the Market action for the stock 600 on our Next 50 level you can see the market had A little time here trying to test the 50 Levels more importantly back here in December but has since broken out come Back to test some of these highs and has Now continued up now all of this is just Looking at the macro picture here as we Continue to take out some big picture 50 Levels but that doesn't mean in the Short term like we're looking at for our March analysis end of February maybe Early March that we could potentially Have a short pullback here and from that Pullback we would then gauge where the Load comes in in order to identify what Happened happens next in the cycle but That's getting Beyond The Objective data That we currently have in the market Let's continue with what else we're Seeing worldwide Now France has been Hitting new all-time highs along with The UK and many of the European Countries doing relatively well this Might not come as a surprise as we now See the world's richest man or richest Family being that of Bernard ano and
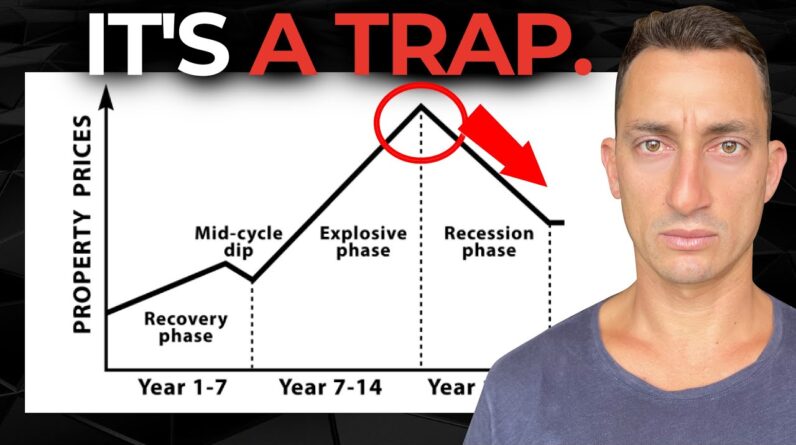
Families now what the hell do they do And what is going off that is increasing The value of their wealth well the Company that he owns is lvmh or Maui Hennessey Louis Vuitton it is a Multi-national Holdings of basically Almost everything luxury goods typically In a recession you wouldn't generally See luxury goods Brands going absolutely Ballistic this is characteristics of a Second stage real estate cycle boom There is going to be a mega bust but Right now we we are seeing a lot of the Fundamental factors coming together for This next stage of the boom now that's Europe putting in new all-time highs What's happening in Asia well let's take A look at some of the largest economies In Asia China and Japan China putting in Fresh highs last month in January Breaking past the major 50 level here After collapsing 45.94 which was exactly the same as what It did in 2015. this was the big bull Run of 2014 2015 for China it collapsed Into mid-2015 and then again went on Another big run so we have dropped the Exact same percentage here 45.94 call it 46 and announcing China Start to come back to life obviously They've started to print some more money That's been the most recent news and That has of course been factored in or Getting factored into the market again
Since the low in in the last week of October now we're starting to test the Major 50 level so a lot of markets are Beginning to come to life in Asia we can Take a look at Japan as well which has Held up relatively well you can see all Of these basing lows here as the rest of The world has been tanking Japan has Been holding up relatively well above Previous resistance levels and this is One of their biggest and strongest moves From their 2009 low if you're just a Recent subscriber this is the 18 to 20 Year cycle that we follow here that Allows us to forecast where we are in The economic cycle we've just started to Come out of the mid-cycle Slowdown we Had that nice boom in 2021 through Assets like real estate crypto and stops And now we've just cooled off from such A mega boom which of course was pumped Full of money this next stage is Potentially going to lead us somewhere Around 2026 Then followed by a decline Not a decline into 2026 but more Increase in value based on 200 years of Data in the US and 300 years of data in The UK so stay tuned to the channel as We continue to follow the 20-year cycle Based on the objective data that we've Got from the charts that are showing new Highs are forming in these markets and New Highs are coming in the real estate Markets as well if you want to get into
More detail with this and become a Full-time investor check out the links In the video description for our premium Membership where we go through how to Trade cryptos and stocks we have plenty Of courses on that and then also putting Together your entire Investment Portfolio looking at the cycles and how We manage our own portfolios link to This is in the video description I trust You found some value from the content so If you did hit that like button Subscribe to the channel plenty more Coming up for you guys as this Market Warms up with a lot of new all-time Highs coming in out out there don't get Fooled by the mass media check us out on Twitter and of course YouTube I'll see You at the next video Until Then peace Out


