🏆 Free Crypto & Economic Report Out Now!
📈 TIA Gann Swing Indicator
🔐 Crypto Storage LEDGER
Subscribe to Michael’s Channel
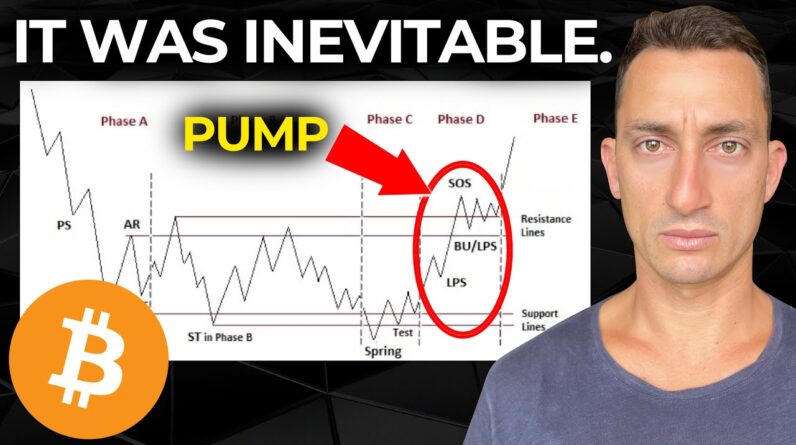
Bitcoin has been pumping uncontrollably for the last 2 weeks. Is the Bitcoin and Crypto bull market back on? Let’s discuss the Wyckoff Accumulation Schematic and what happens next for Bitcoin.
UP TO $48,755 FREE! Crypto Exchanges
🥇 ByBit Free $30,030 + 0% Maker Fees (NO-KYC)
🥈 Bitget Free $8,725 (US + Global Users NO-KYC)
🥉 OKX Bonuses $10,000 (US + Global Users No-KYC)
🇦🇺 Swyftx, Best Australian Crypto Exchange
▶ My Official Socials ◀
YouTube
Instagram
Twitter
▶ My Must-Have Crypto Resources ◀
Education – TIA PREMIUM MEMBERS, Trading Courses & Exclusive Community
Charting – TRADINGVIEW ($30 Off)
Storage – LEDGER
Tax – KOINLY (20% Off)
Trading – TIA GANN SWING INDICATOR
This video is for entertainment purposes only. It is not financial advice and is not an endorsement of any provider, product or service. All trading involves risk. Links above include affiliate commission or referrals. I’m part of an affiliate network and I receive compensation from partnering websites. #crypto #bitcoin #cryptonews
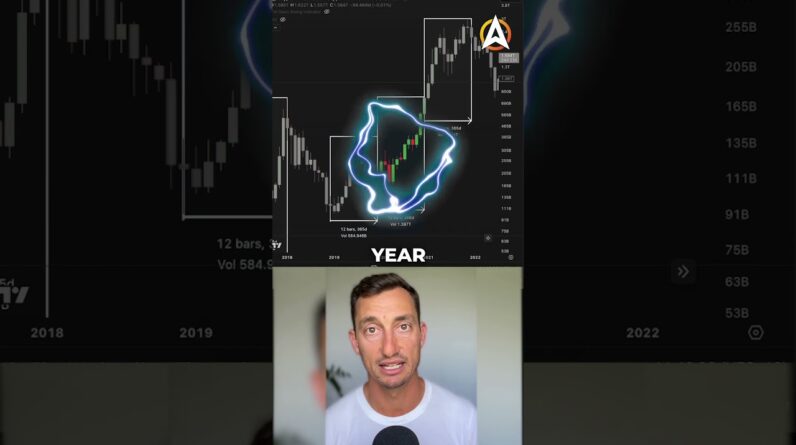
If this chart of Bitcoin from over two Years ago still brings up nightmares for You you've got PTSD from that bull Market you're not going to want to miss This video history looks like it is Repeating again on BTC let's take a look At that in today's update with the Wyckoff analysis looking specifically at The signals around the analysis itself Where we could be wrong and how do we Know if the analysis is on the right Path make sure you like subscribe Bell Notification icon you guys are doing an Amazing job out there smashing up those Likes and watching those videos that I Leave at the end of this video so you Can get the information the education on How to remain with the market and make Profits from it so this is the PTSD the Post-traumatic stress disorder that many Crypto and Bitcoin investors had faced Throughout 2021 and 2022 during the Distribution phase of BTC and then of Course the following bear market now There was a few videos at the time one Of ours in particular as well looking at The distribution of the Bitcoin price Over those periods as you can see the Patterns are pretty identical to each Other for the distribution and it looks Like we're going through something Similar but this time in Reverse at the Bottom so we want to pick out those Points exactly where we could be wrong
If this thing continues to drop and what To look out for should we continue to See Bitcoin rise where are those points In the market to let us know that we are On the right track remember we need to Be prepared for both sides of the market Just like you would if you were going Out into war or you're going to play a Team sport or you're building a business You need to be prepared for all sides of The market not just take one blind Approach to One Direction that is for The fools and they're the ones who lost All the money at the top of the market Just believing it had to go higher Because someone else told them it it had To go to a hundred thousand or three Hundred thousand the same thing is Happening right now in Reverse looking At why Bitcoin has to go to ten thousand Dollars now I've got specific levels Here drawn out with the Wyckoff analysis That will go through as well but just Keep in mind that if this chart is to go Down there are key levels that if it Breaks this is going to be very bad for Bitcoin we do want to get the cheapest Bitcoin possible but there are key Levels that if this breaks down you're Probably going to see even lower prices And a prolonged bear Market that is just Not even worth investing in so let's Keep those levels in mind as well so Looking at the distribution of 2021
We've got a very fast markup to the top And of course we had the drop down which We covered in yesterday's video where we Looked specifically at some signals Right at the top of the market in Particular our day counts and I'll leave A link to those videos at the end of This one so stick around for that but Essentially we had the distribution Through Bitcoin where the price could Not exceed the previous top that we had There and then eventually the market Broke down and so that was a pretty Clear pattern of markup and we had the Sign of weakness the up thrust Still in the trading range which then Moved up into another up thrust so the Final test and that weakness started to Show when the market closed underneath Those levels of the height and the same Sort of thing would happen in Reverse to The downside if we were to fall back Down under these some critical levels That's going to be weakness to the Current potential accumulation period of BTC and of course what happened after That was the market collapsed from that Point so let's fast forward to today and What we can see on the chart what we Potentially could expect save for the Next six months the first half of 2023 So the accumulation Wyckoff event Essentially we're looking for this Particular setup here basically we want
To see that all of the supply has dried Up and that we're starting to get a flip Back into more demand than Supply we've Had that event of FTX Scandal and Collapsing so there was a lot of Cryptocurrency out there in the market Basically flooding into the market now There is some still tied up and that Could eventually make its way out into The market in years to come Which hopefully at the time we are in a Strong bull market so the market is able To absorb that Supply I know a lot of People are still waiting on this massive Dump from the FTX Scandal meaning that There's a lot of cryptocurrency out There that needs to be released from Those platforms so that it can pay back Anyone that's you know owed that money And everyone can go through the Bankruptcy process however like we've Seen with something like Mountain gox Which was a collapse in 2014 of another Cryptocurrency exchange those Bitcoin Have still not made it onto the market Now we are nine years after that event I'm not saying that that could happen to FTX but you have to understand these Things can take a very very long time And it's not like that that crypto has To be released tomorrow and dump this Market down to ten thousand dollars you Know these things take time there's Processes and I think it's kind of silly
To think that that money's gonna all of A sudden just come out into the market Tomorrow so back to the Wyckoff event Here and how this happens and why it Happens the simple chart here of the Price cycle that wyckoff's laid out is Essentially you've got an oversold Accumulation area it seems like we're Going to that now we'll look at it in a Little more detail then you get a markup A demand being greater than Supply Demand Being greater than Supply we just Saw that over the last week with Bitcoin Being brought up to 21k sure there was a Lot of short squeezes going on there as Well but the price has still remained Relatively high sitting at around that 20 to 21 000 at the current time of this Video so we've got to take that into Consideration as well now in terms of What happens next or at least if you're Looking on a macro scale we go through a Distribution an overbought and rinse and Repeat market then comes back down now This happens on all time frames and it Could essentially be happening right now We get the mark up we get a little bit Of a distribution at this level and we Get a mark back down then there could be A higher low that could form another Higher low we go through another Accumulation you get a mark up again you Get a distribution again And then the market comes back down to
Find potentially another higher low so This just happens on all time frames Across all markets and you'll be able to Find signals of it if you pay enough Attention to the particular markets that That you're following So in terms of the Simplicity of what is Going on that's essentially it their Price cycle looking at the accumulation Area markup marked down so going back Down to the accumulation the wipe off Event itself and what we can look out For in terms of more of the significant Signals well we first got a selling Climax for BTC in June so this was the June low the very significant low that We talked about a lot here at 17 and a Half thousand and you might recall that I suggested that If the market is to break down from 17 And a half it probably won't go that Much lower so far that has been the case The bottom to this point here was only 12 so trying to wait for a 10 000 Bitcoin from that point or an eight Thousand dollar Bitcoin you know a 50 Drop from that 17 and a half K so far Has not been a great return for these Investors now we're on our way up and I'm going to get to what I think Potentially happens next and those Prices that we need to look out for Which would be very detrimental to the Current structure and to the Bitcoin
Bull market that we believe is coming up But in terms of where we currently sit This is looking like a pretty good Structure and you know we like to count Bars timing and price Rises to give us An overbalance in these sorts of uh These sorts of times and patterns so From that June low well I think it's Significant and why I think that this Current price move is very very Important and we're nearly at that point It's because we take we take a look back At this June low to the uh August top That is nine bar so nine weeks to that Top and seven thousand six hundred Dollars in a price move so 7590 call it 7600 for a nice easy number so what We're currently experiencing from the The current low of fifteen thousand five Hundred we're up at six thousand one Hundred dollars so the market has moved Up six thousand one hundred and it's Eight weeks up from that point we go out To nine let's go ten weeks because we Want to see an extension in time of the Of the market pushing up That would lead us out to around late January potentially early February for a Time Target and then in terms of a price Target to get us in an overbalanced Situation basically a move higher than What has already happened just Previously it would be looking for a Price at about 23 000 so these are
Really significant areas that I'll be Looking for a major flip add to our Checklist of items to go from a bear Market to a bull market somewhere within The next couple of weeks to go and hit Around that 23 000 if that's the case And we start to see a pullback I would not be expecting this Market to Break any sort of low area from that 15 To 17 K uh price levels and anyone Waiting for 12 10 8 000 is really just Setting themselves up for failure Financial suicide just anything that is Going to destroy their positions in the Future where we currently sit with the The Wyckoff analysis here that was our Selling Climax and I went on a bit of a Tangent there looking at particular Price targets that I'm waiting for to See the market Bounce from that point Next we had the secondary tests that is Right here in July we had another Secondary test in September and October So that's what we can see on this Particular chart here the points in Between are the automatic rallies and Then we want to start to establish a Trading range here so so far the trading Range is above this level here around 25 200 and to the underside you could Probably say somewhere around 17 and a Half K with the springtime Being that 15 16k level up to that 17 And a half K level so that's the spring
You got the test and now the market has Burst back up into this this space here So we're well within this phase C Potentially even phase D of the Wyckoff Accumulation So it looks like history is repeating Again where can we be assured that this Is into a accumulation event rather than Another redistribution in the market is To collapse well what we're looking for Next is this right here so we have the Last points of Supply the LPS and then We have the the SOS up here so we've got The phase D breakout of the trading Range and then a consolidation above the Trading range and then the market starts To moot so what's that going to look Like for us on the chart here well I Brought up that point of the market Moving at least this in time and price From the low So I hope that it comes up to somewhere Around 23 and of course what I hope for And what happens in the market are Potentially two different things but Moving on from that basically if we are To get this move then we're looking at Some sort of last point of Supply Hopefully accumulating in the short term Above these levels another move up and Potentially breaking that And then consolidating above those Levels or just screaming off to new Highs and then I'm getting those break
Break backs at around that 30 cats Something like that but essentially We're looking towards what happens what Is the Market's reaction when it gets to That 25k are we about to top out here at 21 to 23k and then have a pullback and Then wait again or we're just going to Scream ahead and push to those levels Above so they're the key levels that We're now watching for to identify Whether we are on track for the Accumulation the what the breakdown Would look like is of course a failure Here a drop back to the low maybe a Little bounce and then a fall into this Zone here it's not a good thing if we Fall back into this Zone here as much as People are waiting for the lowest price Bitcoin 17 and a half K or under is Probably not a great thing at this point In time especially after this particular Week that we had here which I think is Setting up to be a a Wyckoff change in Behavior so that you've got the extreme Volume so pretty high volume compared to Anything that you've seen in the past Barring the FTX event here and a couple Of weeks that we had in September so It's very very high volume push to the Upside it broke resistance levels at 17 And a half so if you were to lose that Low price that is going to be a signal That the market is extremely weak and You probably expect further downside so
Although people waiting for that maybe It happens maybe it doesn't we're going To be prepared for both so in terms of Time overall we have been within the Zone we're calling it from June and we Take a measure to the current date That's 31 Baht so basically 31 weeks at This level and now if we get some sort Of move to the upside gonna be another Couple of weeks maybe we start to get a Fall back into February March which is What we've been talking about here for Weeks on the channel now looking for Some sort of pullback across all major Markets you know the the s p major stock Markets because they can't just go up in Australia straight line and eventually We do get that that pullback so if That's all falling into alignment with Bitcoin and USD and those and the major Indices then maybe we start to expect That move out of that pullback so what It looks like is something maybe like This that move out of that pullback Probably sometime in quarter two and so That's going to then start to give us a Signal or are we going to see the Accumulation Zone end and then start to Move out into new higher prices sometime In the second half of 2023 or if we're Lucky sometime in the late first half of 2023. if you found the content Interesting and helpful to your own Portfolios you followed along for some
Time but you still are yet to make that Click that decision to get onto the Economic and crypto report comes out Once every two weeks go and check out The link in the top of the video Description absolutely free check that Thing out down there and of course our Downswing indicators also in that top of The of the video description as well so In terms of the structure things are Lining up for this Wyckoff accumulation It looks like history is repeating and If it doesn't and we head down into a Distribution we'll know because this Particular bar here will have the load Broken and that low is around 17 100 Just like what happens when we look at The Wyckoff bullish flip bars basically Overtaking the entire price range of a Significant event that we've seen come Up on the price chart like we saw here With FTX this top was at 21 065 we've Now broken that and you can see the Momentum flipping to the to the upside Again the same thing that happened to The downside so we're going to keep Watching those levels so far things seem Like they are on track to be coming Through this accumulation sometime Within the first half of 2023 so don't Go anywhere especially now especially After getting through the PTSD of the Bear market and that distribution phase Of Bitcoin in 21 and 22. stick around
This looks like it's setting up for some In interesting price action throughout 2023 and eventually it's going to be Time for those longer term altcoin Swings so like subscribe stick around on The channel check out the links top of The video description I'll see you guys At the next video go and check out the Videos that are popping up on your left Hand side right now which are all these Ones here with the massive information From the macros going on right there all Right that's enough for me from Dubai See you guys again real soon on the Channel until then take care and peace Out


