🏆 Free Crypto & Economic Report Emailed To You!
📈 TIA Gann Swing Indicator
🔐 Crypto Storage LEDGER
Has my macro outlook for Stocks, Real Estate, Bitcoin and Crypto changed? No.
So in today’s video, let’s discuss the massive traps and violent moves that smart money is anticipating due to interest rate hike announcements.
▶ Subscribe to the channel for more macro market analysis on Bitcoin, Crypto, Stock Markets and Real Estate Cycles.
Subscribe to Michael’s Channel
UP TO $48,755 FREE! Crypto Exchanges
🥇 ByBit Free $30,030 + 0% Maker Fees (NO-KYC)
🥈 Bitget Free $8,725 (US + Global Users NO-KYC)
🥉 OKX Bonuses $10,000 (US + Global Users No-KYC)
🇦🇺 Swyftx, Best Australian Crypto Exchange
▶ My Official Socials ◀
YouTube
Instagram
Twitter
▶ My Must-Have Crypto Resources ◀
Education – TIA PREMIUM MEMBERS, Trading Courses & Exclusive Community
Charting – TRADINGVIEW ($30 Off)
Storage – LEDGER
Tax – KOINLY (20% Off)
Trading – TIA GANN SWING INDICATOR
This video is for entertainment purposes only. It is not financial advice and is not an endorsement of any provider, product or service. All trading involves risk. Links above include affiliate commission or referrals. I’m part of an affiliate network and I receive compensation from partnering websites. #crypto #bitcoin #cryptonews
We saw further declines in stocks and Cryptocurrencies overnight with the fomc Meeting minutes being released let's Look at what this means to the market Moving forward and how some of these Moves are beginning to trigger massive Moves coming up in the markets in Today's video let's look at some of the Major oversold indicators and the Possibility of smart money already Pricing in further interest rate Rises If you haven't already like subscribe And top of the video description is our Free crypto and economic report quick Shout out to our Channel sponsors as Well buy a bit thirty thousand dollars Of sign up bonuses bit get and of course For the Aussies Swift X down below for Your cryptocurrency trading so let's First start with what's happened Overnight we have the fomc meeting Minutes suggest fed fears Financial Conditions decoupling for next month's Meeting we're looking at an interest Rate rise of a quarter of a percent with The probabilities being three quarters Expecting the 0.25 percent rate rise the Following month we're looking at a extra 0.25 percent the meeting in May the next Meeting in June looking at another Interest rate rise and this is where now It looks like we might taper off at Somewhere between 5.25 and 5.5 With further declines to come later in
The year but we're not seeing the Downside in the s p that I guess many Would have anticipated if these interest Rates weren't already priced in so Although the expectation is slowly Creeping up for the interest rates to Increase an extra of a quarter percent The stock market may have already prices In as the declines are basically coming Back to tests and previous support Resistance zones like we just saw Overnight around the 4 000 Point level Now we've been tracking this looking at Our specific key support levels you know Those are sitting around the 3 800 Points which comes in at the previous Swing bottom so this is going going to Be a good level to test as well this may Then mean that the s p does drop back Below the bear Market downtrend but We're not there yet let's wait and see How long this takes to occur and then Following a drop if it is to go below 3 800 we still have the levels sitting at Around 3 600 points so it's going to be A day by day situation to see how the Market continues to price in further News about interest rate Rises but for Now it is sitting up much higher than Where we were in October with the low And then the previous low in around December the other benefit to this is It's sitting above its 50 level or dead On the 50 level right now around 4 000
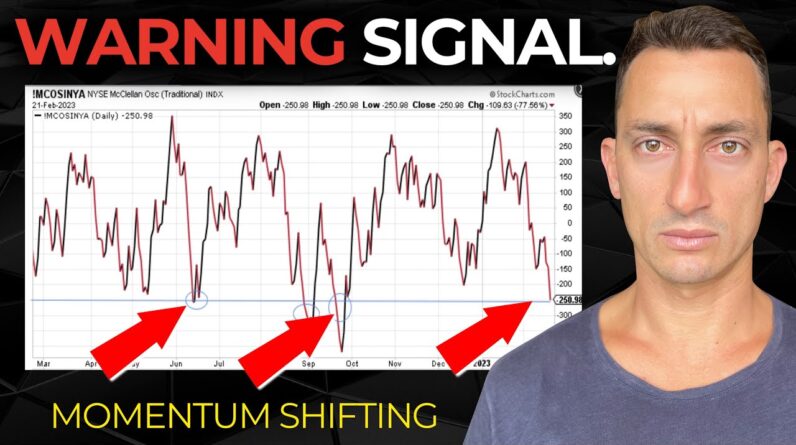
Points coming in at 3980 points we are 11 points higher than That for the s p now for the oversold Conditions of the markets we're looking At the McLennan oscillator this has been Pretty good at timing some of the Bottoms in the market and just using This as a preemptive of indicator to Identify whether we are seeing a current Bottom being formed or if we still have Further to drop in the market now only Looking back over the last 15 months Here we are at about the third to Fourth Lowest reading if you want to consider September October as one reading June is Another reading we're into that third Period right now and so these have all Marked considerable lows in the market So looking at the September October There was that one significant low in October and that came out here in the Reading it extremely oversold and we Obviously saw a bounce from that point June also saw another oversold reading And we had a very significant low form In the market and at that time like we Were talking about on the channel just Looking at the data here on the charts Because of how oversold the market Seemed and how close we were getting to The 50 level the technical indicator Here it seemed like even if the market Was to drop lower and you may remember Me saying this it didn't seem like it
Would go that much lower and in fact That's precisely what happened so we're At 3 600 points and it dropped to 3 500 Points so approximately four percent for The S P 500 and we know from history now Bitcoin went from 17 and a half down to 15 and a half in a similar sort of Fashion now the December low that came In was also another oversold reading Here but nowhere near underneath this Line where the other three readings were But it also managed to put in a low the Interesting part about this particular Indicator right now is that we are below The December low so the oversold reading Here the December low for the stock Market is obviously lower than where we Currently are on price so we're getting An oversold reading here with stocks Being more sold than what they were back In the December low you can see here we Are now currently at 4 000 the December Low was at around 37 30 800 points on The S P 500 yet the oversold conditions Are more extreme at this point which Usually means that we're in some sort of Divergence area it doesn't mean that This is the low but it seems like we'll Get a turn soon and we've been following This as a potential Turning Point late February or sometime in March so it Could still be a few weeks off or a week Or so the McClellan try and say that Three times fast summation index here
Which is the oscillator that we are Looking at is essentially a market Breadth indicator based on stock Advances and decline so basically how Many stocks in terms of percentages are Going up how many are going down and Taking a reading of that if you want the Formula here it is right there seems a Little too boring for us to go into it In this video but nonetheless this is Essentially just looking at the breadth Of stocks which gives us the indicator Of are we getting too far oversold or Too far overboard the McClellan Oscillator is the market breath Indicator so it's something similar to a Macd we know that this is used quite Often in trading from other technical Traders looking at their macds so we're Just looking at the this bull market From 2009. of course we'd need some more Info for the the bear Market I'd love to Go and test this a little more but just Using what we have here that was put out By another Trader looking at where these Major lows came in in the market doesn't Necessarily mean that it's going to be The exact line we're not looking for a Hundred percent indicators here but Essentially just looking at how well This has timed some of those significant Lows in the market you can see that the Major low here from October 2008 had the Very oversold conditions on the
Oscillator then we look further down to November which had a higher low so You're starting to get a Divergence Between price and the oscillator there's Only so far that you can sell a market Off yet the market sentiment or at least The public still believes there is a lot Further to go you can see from November Into the bottom in March the reading was From around 750 to 760 points on the S P To that final low around 690 so there is Still there could still be a little Further to to run but this is at the end Of a major cycle something like the GFC Collapse which is not what we have seen This year it is essentially tightening From the FED it is not an all-out land And economic collapse so two different Times in the market but all we're Looking to do here is the reading so as We continue to go across the oscillator You can see some significant lows that Have formed in the s p have also been Significant Oversold times in the s p as well from The McClellan reading here on the Oscillator it's moving forward to 2011 Very heavily oversold we had a double Bottom you can see the reading was Higher the market started to move you Had another higher low forming with Oversold conditions And then continuing up into those Peaks And the cycle continues to repeat
Oversold we get bottoms come forward to A little further here into 2016 and again over and over again and So from this point we're looking at Markets to go up and so if you do fast Forward you can see that from this time Markets continue to move up does this Work on all markets well essentially yes It does work on all markets but it's not Going to be that extreme leading Indicator that tells us that this is the Exact bottom it generally comes a little Way after the bottom but that's not such An issue if the market hasn't pumped Super hard from that bottom that's going To be up to your own decision what super Hard is now your definition of super Hard may be different to your partner's Definition but we'll leave it at that We're just looking at the charts here And we'll leave my own opinion to the End of the video looking at the macd you Can see that we had some extreme Overbought conditions going into the Peak in April the over the buying laid Off and then we got into another Peak Which of course was a lower top and you Can see the Divergence begin to happen On a much bigger time frame here looking At a monthly chart the same sort of deal Has happened now for the oversold Conditions it can be oversold longer Than what we can anticipate but Eventually the tides turn this is all
Just part of typical Cycles Cycles are Everywhere of course they're even Prevalent in the markets and we just Take a step back to the previous cycle Again you can see the market moving up Into some extreme overbought conditions At that Peak the market dies off and Then we have some extreme oversold Conditions so right now on bitcoin just Using the macd we are coming out of some Extreme oversold conditions that doesn't Mean that we can't get further downside But typically what we've seen here that Once we come out of some extreme Oversold conditions the market doesn't Revisit those prices that's that's What's happened in 2018 can move this Forward to look at whether the overall Sport came in the oversold was also Again in March 2020 the pandemic low but The price didn't reach the previous Oversold conditions going back to 2014 You can see the overbought conditions Into the peak which then led to the Collapse we got the over sold conditions Into that low of January 2015 and Although the market went sideways had a Pretty good period of accumulation we Never saw the extreme oversold Conditions again and then the market Flips and so we just don't typically see From extreme oversoul conditions another Extreme oversold condition on something Like a macd an oscillator between
Heavily overbought and heavily oversold If we take it out to a long enough time Frame something like a monthly chart I'll give you my thoughts on the market But just a reminder if you are finding Value from the content like And Subscribe the easiest way to support the Channel for free and if you want more Information about macro Cycles the stuff That we trade and invest in full time in Faster accelerator there's your link in The top of the video description but if You want to further your education Before the start of another bull market Check out the link further down to Tia Premium that is our premium course Hundreds of hours of content learn how Learning how to trade cryptocurrencies Or stocks and of course invest for the Long term looking at our major macro Cycles there so in terms of what I think Is coming next because I've never seen The market drop below significant Oversold areas it doesn't mean that I Believe that we're only going to go up From here we do see markets pull back After some significant price Rises of Course for now it doesn't look like in Terms of the the monthly area here it Doesn't look like we're about to go and Collapse to fifteen thousand dollars but I am preparing for any sort of Opportunities to buy at further lower Prices from where we currently are on
BTC obviously on The Daily we did just Have another sell-off day for Bitcoin But we closed up higher and closed again Above around this 23 and a half to Yesterday we closed at twenty four Thousand one hundred and so while we Continue to see some strength and some Consolidation in the short term above Previous resistance levels which may now Becoming support it's hard to believe That the market is going to collapse to Much lower prices the strength for the Bears is unfortunately not there just Yet of course I would love lower prices To be buying up cheaper but we've got to Stay with the trend and while the trend Is still above that 23k level the trend Is your friend Until the End going out To a weekly chart it does look like We'll have to get a rollover eventually But these things can go on longer than One can anticipate or one would expect It's what typically happens in the Market until we get to those Max Payne Areas where the Bulls are all in the Bears have also jumped in and then we Get that roll over to wash out some of Those those weekends the late entrance To the market and so although the the Macd here has been up for some time on The weekly chart now going from the Daily to the weekly doesn't necessarily Mean this has to be the end but any sort Of downside move that we may and may get
From Bitcoin on the weekly chart here Maybe less than what has come up on the Three previous occasions of the downside Move this probably will coincide with Any sort of down move for the s p as Well but if Bitcoin manages to hold up At these levels and just creep slowly Down this is going to show that there is More strength in Bitcoin than in the s p At least in that short term period so What I'll be doing is waiting for those Lower prices those tests of lower prices I've talked about that on Twitter and Mentioned some good buying areas so if You aren't already Twitter's down there And also Instagram where I do some q and A's with you guys that is what I'm Waiting for for BTC in the meantime as The market continues to hold hold up at These higher prices we just have to go With what the market is giving us and With that said like And subscribe check Out the videos that are popping up on Your left hand side for the macro Outlook on the markets I'll see you guys At the next video let me know in the Comments section down below are we going To hold these levels or are we about to Collapse past 21 000 love to hear from You guys based on your own analysis out There I'll see you at the next one until Then peace out


