🏆 Free Crypto & Economic Report Out Now!
📈 TIA Gann Swing Indicator
🔐 Crypto Storage LEDGER
Subscribe to Michael’s Channel
Major signals are flashing in the SP500 stock market and Bitcoin right now. In this video, let’s discuss the VIX, Economic Optimism and Put/Call Ratio De-trended along with Bitcoin immediate term price resistance levels.
UP TO $38,755 FREE! Crypto Exchanges
🥇 ByBit Free $30,030 + 0% Maker Fees (NO-KYC)
🥈 Bitget Free $8,725 (US + Global Users NO-KYC)
🇦🇺 Swyftx, Best Australian Crypto Exchange
▶ My Official Socials ◀
YouTube
Instagram
Twitter
▶ My Must-Have Crypto Resources ◀
Education – TIA PREMIUM MEMBERS, Trading Courses & Exclusive Community
Charting – TRADINGVIEW ($30 Off)
Storage – LEDGER
Tax – KOINLY (20% Off)
Trading – TIA GANN SWING INDICATOR
This video is for entertainment purposes only. It is not financial advice and is not an endorsement of any provider, product or service. All trading involves risk. Links above include affiliate commission or referrals. I’m part of an affiliate network and I receive compensation from partnering websites. #crypto #bitcoin #cryptonews
Core inflation data is due out this week And we may be seeing the market turning A corner from depressed to slightly less Depressed and eventually to optimistic But generally this happens all far too Late and in today's video we're going to Look at several charts which point this Out throughout history where the Investor is always left last wondering How did this happen to me again Especially for the ones who follow Reports and news and a lot of the Information out there that points Towards deep heavy recession and high Volatile markets in 2023 in fact the Data is just not showing that at this Point in time that's what we're diving Into in today's video make sure you like And subscribe to the channel if you're Finding some value and of course I'll Remind you throughout the video if you Want to wait to see what you're getting In these YouTube videos all right guys Let's dive in with the first piece of Data we have three things to look at Today we have the vix we're going to see How this relates to the S P 500 over History we have the economic optimism Chart here as well and how this is Related to the market bottoms throughout History and the third thing is the put And call ratio detrended has skyrocketed To all-time high levels this usually Means a lot of Max Payne to investors
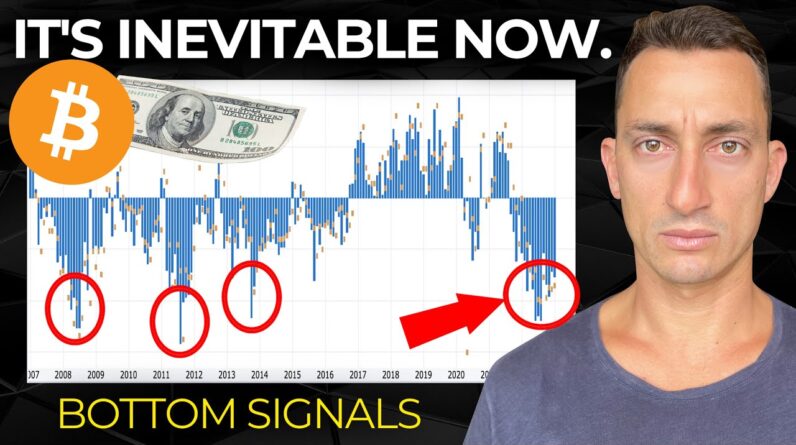
Who are hoping and waiting for more Downside to the market as they attempt To place orders to short the market at Higher prices we are your home of macro Cycle analysis on the stock market Bitcoin of course the real estate cycle If you want to stick around for the Journey make sure you do subscribe to The channel share it with a friend if You're finding some value from the Content these last several videos over The last several weeks actually have Been popping off and you guys have been Finding a lot of value from it I've been Noticing it from the comments section as Well so it's really really valuable a Help to hear from you guys in the Comments after these videos so thank you Very much for all of that engagement on YouTube as well it's doing a lot of Favors here so the first piece we want To cover is a quick look at the economic Optimism now I don't Focus heavily on This however I do find the trends quite Interesting of where the market Sentiment is at at particular times in The data itself you can see we had the GFC market is heading down the market Was extremely pessimistic or not as Optimistic as the reading shows during The bottom well during the crash itself And then as we get to that final low we Start to creep out of it however the Market is still not so optimistic even
During the climb out of the lows you can See that here in 2008 we jump into 2009 And the Market's still not as optimistic This wasn't such a bad reading through That entire period but then you jump Into little spikes like August of 2011 The reading under 50 is pretty heavy Here with people being far less Optimistic about the economy and that's August September remember October November and that basically drives all The way into 2012 and we have a look at That on the chart here this is that Period there so they're quite fearful of The market during these lows and as it Climbs out which is after the low they Feel a little better about the economy And that tends to happen every single Time as we pointed out here on the chart You've got the middle of 2010 so here is That 2010 reading as the market climbs Out after the low then people feel a Little bit better about the whole Economy once the market has moved to New Highs and so we're trying to get a bit Of a leading indicator here we're not Looking for anything that's a hundred Percent because there is nothing that Gives you a 100 guarantee in investing Otherwise everyone would be extremely Rich right but what we're looking for Are some Trends some things that we've Seen over time that show when we're Basically climbing out of a particular
Low or maybe at a top in future times Right now we're obviously searching for A bottom the market seems to be putting That in we have a look here again in Late 2014 and late or middle of 2015 That is these readings right here so There's the 2014 and here is the 2015 as Well people very fearful at the bottom Of the market and we just want to fast Forward to where we currently sit today And that is basically right here we've Got the June the July and the August Reading and then we're starting to get a Little more optimistic still obviously Below the 50 level here but you can see It's starting to die off even though the Media that we've seen over the last Several months is trying to stuff this Full with depression recession bad Things High volatility coming in 2023 These are the two areas here you can see The June low and the October low which We've looked at many many times on the Channel here looking at the market Forming a bottom so far so good sure We're trying not to to call the exact Low right now we still need some further Confirmation but things are looking up And we have to start finding that data While the market is fearful we're never Going to get those positive feelings at The lows otherwise it just would not be A load that's how the markets work the Same sort of deal at the top the Top's
Always going to be extremely positive You can see here February 2020 which was The top before the pandemic crash This is the time where people are Expecting higher and higher prices and You're just not going to hear or feel About that bad news it always happens The same way in Reverse now we also have Core inflation data and inflation data Coming out this week in the next day or Two and the market is anticipating a Drop in inflation as well so this could Be the shifting and the Turning of the Tides where we have peaked out in 2022 Basically June was that Peak and the Inflation rate here and of course core Came in a little bit later but if this Continues down then the FED is going to Have to obviously halt any of the Interest rate Rises or at least drop Them from their 75 base of points or 50 Base points maybe drop that down a Little bit maybe to a quarter of a Percent over the coming meetings that They have in the first half of the Year And that of course is going to be quite Bullish for the market even though we See maybe see smaller rate hikes because The market often anticipates this in Advance their X expecting lower rate Hikes and if they get it that obviously Meets the expectation and so people are A little more bullish or at least Investors that understand this are a
Little more bullish at the time when Everyone else is still quite fearful of The market now the second thing we're Looking at was the equity put and call Ratio as we've talked about in the intro This is where investors get extremely Bearish about the market and start to Put in a whole lot of put options Meaning they want the market to go down They're betting big on a downside move In the market and these are the new Trend everyone is trying to bet short Especially as we see the market hit some Resistance on the shorter term time Frames you can see that marketers hit Once on the 13th of December and we're Starting to climb back out of this low Now so it looks like they're trying to Short the market and hope for further Downside if this doesn't go the way of The shorts then you can expect to see a Big capitulation move to the upside if In fact there is is a lot of Short Selling going on and what that often Looks like is a big move to the upside Breaking out of a lot of the resistance That we've seen over the last 12 to 13 Months coming in from that all-time high So this has been that downtrend which Has remained on the S P throughout this Entire period and what we've been Looking at here is the bottoming process Happening a lot of people are expecting A big further downside potentially this
Is now a higher low still a little too Early to call on the daily chart it's Definitely got the higher low confirmed But what we're waiting for is something In terms of a weekly higher low to come In and also a monthly high low with the Breakout of the downtrend so we're still Within this training zone of 3 600 Points to around 4 200 points the goal Here is to get back above 4200 which was Previous support and previous resistance So we want that support and resistance Flip and this put call ratio could be The thing that gets us to this big Breakout move and hopefully a breakout And then a consolidation above that 41 To 4200 Point level on the S P now a Third indicator is the vix before we get To that you know the drill like Subscribe and potentially share the Content with a friend if you're finding Some value from it and if you do want to Know more about the channel and the Investor accelerator click the links in The top of the video description for our Free report that comes out once every Two weeks and is due out very soon so Get on that list and get that free Report around stocks the real estate Cycle and of course Bitcoin and Cryptocurrencies all right let's take a Look at what's going on with the vix Right now so this one here is posted From Seth so thanks very much to Seth
Over here the vix itself in the third Year of the decade shows a declining Trend so what we've often seen is the Vix rise and then starts to come down What does that mean well when we get big Spikes in the vix that is almost always At the bottoms of the market and so once We see the vix start to decline here and As you can see on the reading that's Usually an indication of a market going Up what we've seen in 2022 is not very Heavy spiked to the upside however each Of these spikes has correlated with Market bottoms you can see we had May And June this period right here and then We had September and October which was Also the bottom on the S P so here are The monthly bottoms at June and then Again and in October and the reading From the vix is basically directly after That point there and we haven't had Extreme spikes in the vix which means we Haven't had extreme bottoms and Sometimes we do get these subdued Rounding Bottoms in the market with some Attempts to test those lows again we Haven't got that just yet we could go Through that in February or March as We've pointed out in the videos last Week looking at the 2023 predictions of A potential roadmap Apple cycle for the S p in 2023 to give us a rough idea of Where we could see the movement of the Chart throughout this year so we
Continue to keep an eye on that but if We take a look at some of the other Major spikes in the market you've got August of 2015 we've got February 2018 And of course March 2020 going back to The Chart here on the monthly s p there Is your March 2020 there is your December 2018. there is December here is February as well there is that little Spike there which was still a Significant low at that time remember The feeling of the market at that time People were expecting much further Downside because the market had been up For the last nine years and then we can Look back to the other spikes in the Vic As well going to that August September Period of 2015 so that's that low right There and so on this continues to happen Time and time again in the market and Once we start to see a full and the the Lessening of the volatility this usually Leads to Market Rises so using our Gan Swing indicator there's a link to this In the top of the video description this Helps tremendously to determine the Trend of the market you always want to Know whether you're in an uptrend or a Downtrend and by following the swing Indicator as I said it's the in the top Of the video description you can Determine when this the trend has been Broken and see very clearly on the chart When you've got a clear downtrend lower
Highs and lower lows and then the clean Break of the lows as well to get those Lower lows coming in so this is still Early days I'd want to see a monthly Close because this is the chart that We're on here we're on the monthly but If this is to occur if the s p is to Reverse here and start to Trend up Potentially slowly over 2023 we would Then expect the vix to continue in the Downtrend here and potentially take out The level here that was supported around 19 and then start to Trend back into This lower section here which has been a Very good area for bull markets to start And continue into this is a good sign For markets to increase so that's a lot Of interesting data and cycle analysis On the vix just looking at the years Ending in three which is what we're Currently in 2023. this isn't done in a Lot of places around the economic space But it has a very significant impact on The markets if you can understand those Years this year 2023 potentially going Into a lower volatile Market which could Then mean that the s p major markets Will start to climb out of these lows That they saw in years ending in two so That leads us on to bitcoin and what to Expect next looking at the short term And the medium term here as we saw some Of those capitulation signals Potentially coming up for the s p I
Think there's going to catch a lot of People by surprise should we start to Break out of those levels based on what We've seen there in those last three Things there so in terms of BTC this is Still on the rise over the last few days As well we're heading towards some Resistance levels here and as we pointed Out in recent videos at 17 and a half Obviously being the previous low from June is getting quite close again as I Record this 17 440 with the peak yesterday at nearly 17 And a half thousand so 100 bucks away From that low with many people's still Expecting ten thousand dollars this Could be heartache for these guys always Important not to have your eyes set on a Particular price Target but a time Target the low could be in here and if We start to see a break above 17 and a Half and then we have the next level Which is around that 18 and a half all That previous support and get flipped to Resistance it's going to be very hard For the Bears to take control again and Dump this Market to new lows especially If we're seeing the vix start to drop Which then means the s p start to climb And risk on becoming a little more Interesting for many investors so with BTC currently at these lows and starting To climb higher not to say that we can't Drop back and test some lower prices but
If we do climb out and break the 18 and A half K level which is a pretty clear Support and resistance level this could Be very very difficult for Bears to take Control especially with the macro Outlook looking like we're about to turn A bottom which can take months so be Patient make sure you do subscribe to The channel check out the links in the Top of the video description for the Free economic and crypto report and of Course our Gan swing indicator and for Those Traders out there you know who you Are there is still bonuses massive Bonuses going on with buy bit and bitget Links are in the video description for Those to get up to 38 crazy 38 000 on Those exchanges stay safe out there I'll See you guys at the next one until then Peace out


