🇦🇺 (LIMITED TIME $20 FREE BTC) Swyftx, Best Australian Crypto Exchange
🔐 (LIMITED TIME $30 FREE BTC) Crypto Storage w LEDGER
🟠 (LIMITED TIME FREE BTC FOR 🇦🇺) Bitget Free $8,725 (US + Global Users NO-KYC)
🏆 Free Crypto & Economic Report Emailed To You:
👾 Free TIA Community Discord:
📈 TIA Gann Swing Indicator
🔥 TIA Premium! Trading Courses & Exclusive Community
▶ Subscribe to the channel for more macro market analysis on Bitcoin, Crypto, Stock Markets and Real Estate Cycles.
UP TO $38,755 FREE! Crypto Exchanges
🥇 ByBit Free $30,030 + 0% Maker Fees (NO-KYC)
🥈 Bitget Free $8,725 (US + Global Users NO-KYC)
🇦🇺 Swyftx, Best Australian Crypto Exchange, $20 Free BTC
▶ My Official Socials ◀
YouTube
Instagram
Twitter
▶ My Must-Have Crypto Resources ◀
Education – TIA PREMIUM MEMBERS, Trading Courses & Exclusive Community
Charting – TRADINGVIEW ($30 Off)
Storage – LEDGER
Tax – KOINLY (20% Off)
Trading – TIA GANN SWING INDICATOR
Channel Sponsor: New Brighton Capital, Aussie SMSF specialists. Book your Free consult and use code “Pizzino” for $200 credit off:
This video is for entertainment purposes only. It is not financial advice and is not an endorsement of any provider, product or service. All trading involves risk. Links above include affiliate commission or referrals. I’m part of an affiliate network and I receive compensation from partnering websites. #crypto #bitcoin #cryptonews
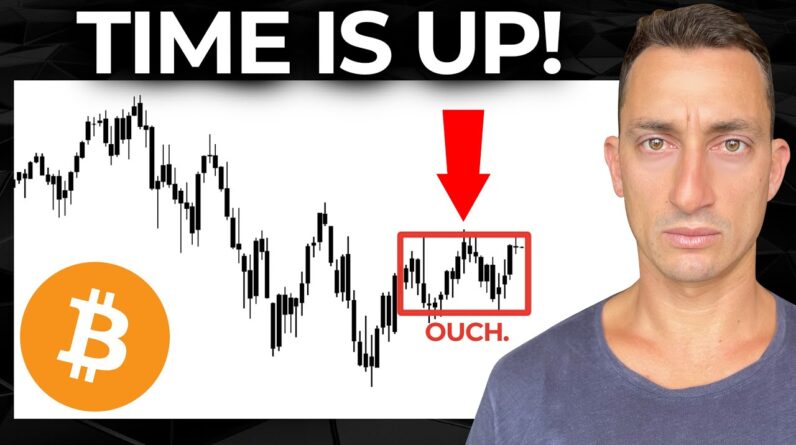
Bitcoin just closed at its highest level In 44 weeks and its highest level in 2023 and like we'll show in today's Video time is fast running out for the Bearish investors across Bitcoin cryptos And the traditional markets our S P 500 And the NASDAQ that's what we're looking At in today's video so make sure you Have subscribed with that like button Clicked on down below and if you're in Aussie there are a couple promos going On for you guys with bitget link is in The video description sign up using Those links you can share in one Bitcoin And for Swift X your on-ramps here They've doubled the sign up bonuses all Right so enough of the shells let's have A look at what's going on with BTC and The stock market this is your home of Macro cycle analysis you're not going to Get this anywhere else across the Internet because most people are bearish Right now and I know this because I Follow up on what's going on in the Market sentiment very closely across Twitter and YouTube and I hope you do The same as well so in terms of BTC Right now we're have just seen it close At its highest level in 44 weeks highest Level in 2023 typically this is not what you Would expect in a bear market and I also Want to show you three macro signals That we are following for the 100
Confirmation that we are in a bull Market now we've had one of those Signals crossed we're on our way to the Second one very very soon and then the Third one is still about fourteen Thousand dollars away before we get to The signals what's happening in the Market this week is CPI we've got CPI on Wednesday on Thursday we have more fomc Meeting minutes that's going on and then Also on Friday there are a few other Announcements here from the US now if You are a subscriber of the channel and A subscriber for some time you'll know That we just look at these things to Identify if we're going to get some Volatility in the market what happens at These meetings doesn't necessarily push The cycle in either direction once the Cycle is in play it's up or down things Remain that way and I know this is not What the majority of people believe they Really wait at the edge of their seats To see what happens at these meetings But like we've identified many many Times before it doesn't really matter This is basically just a soap opera for Anyone that is new to the market or even Existing people who just want some sort Of explanation to what's going on as you Know from technical analysis the chart Tells us what is going on in terms of The buyers and the sellers the investors In the market and the News can just make
Up any sort of narrative people just Take a narrative of what's going on so They can and try to make sense of what Is happening in the market but as long As you have an idea of what is going on In the cycle and you're following the Charts you've got all the information You need all the power is with you and Not with the news items that's what I Want to give you is some sort of Empowering message because we have what We need here in the charts rather than That stuff that's going on out in the News headlines so as we can see the Market is up highest closes so far but In terms of the daily we're still in our Consolidation range here that's been Going on for 24 days since the 17th of March when we had that nice pump up from 25k up to around 27.5 000 so we've Actually been in this range since middle Of March and we're currently getting Close to the middle of April so we're in This particular range yes the price can Go either way but because the market is In an uptrend we're seeing some higher Highs and higher lows then you have to Give the bias to the Bulls this is on The short term trading here so the bias Is towards the upside there's always a Possibility that we get some nice fake Out to the downside than a push back Into the range typically that's what I Would prefer to see based on what I've
Seen in the past over my 12 plus years Of trading if we get a breakout to the Downside or breakdown then we can at Least take out some of the stops so the Market can then rally up and push a Little bit harder but we keep going up From this point and fake back into the Zone that is really quite weak for the Price depending on which chart we're on In this case we're in Bitcoin so it's Really weak for the market if we push up Out of the Zone then back into the zone That is a very weak signal so keep a Lookout for that should it happen this Week or next week as we're getting Towards the end of our trading ranges Here so that's the weakness and the Strength that we could see in the Markets how else we could see strengths If it breaks out and remains above the Trading range that's what you want to See break out and hold above that's a Good sign a breakout and close back Under the trading range that's a bad Sign it's a bad sign depending on which Way you are looking at the market so It's a good thing for the Bears a bad Thing for the Bulls what else we're Seeing here well we're seeing the total Cryptocurrency market cap also breaking Out it's at its highest weekly close in The last 44 weeks as well just like Bitcoin so this is a pretty pretty Strong sign here for the total
Cryptocurrency market cap 50 of it's Made up of BTC what the market is Telling us is that the smart money is Buying up here that's the terminology in The market dumb and smart if you don't Like the the terminology I can't help You in that regard but in this case what We're seeing is more buying from Smart Money getting in here they are saying That they are not concerned with the Previous news announcements or the news Headlines of the market back in June Back in August back in November and all Of this period through March because of The price is now higher or Meeting those Levels so what does that mean well Basically November was the FTX collapse August was the period where F the S P 500 had its peak and then dropped into a Low into October the June July drop here This June low was after the UST lunar Collapse these are all part of the new Cycles and if you get the price Meeting Those levels it essentially means that Investors are not worried about this Event anymore and it's priced into the Market so that's a good sign if you are Bullish on the market this is all part Of reading the market tape reading Watching what the smart money and the Dumb money are doing on the charts it's Basically Wyckoff analysis if you are Interested we do have a full Wyckoff Analysis course here on our website so
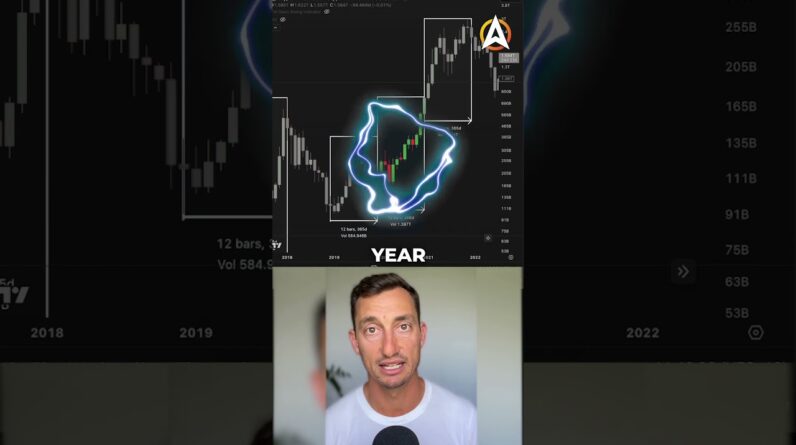
Go and check that out if you want that Sign up to this one here the premium Membership and there is a ton of content There educational content that goes from Beginner to Advanced with trading and Long-term investing so if you are Interested check that link out in the Top of the video description so back to The markets overall and the three macro Signals that we are still waiting for Well here they are right here we've got Our over balance in price and time our Log downtrend so the breaking of that Basically breaking of the bear market Downtrend and then reaching the macro 50 Level so so far we've broken the log Downtrend we've covered that many many Times before basically it was from the Top to the next significant levels here Which was the top in March and we broke Out in January held the line in February Held it again during the banking crisis That was a collapse there in March and We are now a significant away away from That point so we can say the log Trend That signal has been met now we have the Overbalance in time and price where is That well it's back here so what we're Looking for is the biggest range in the Downtrend in time and price and what we Want to see in terms of the market is That it exceeds the time and price this Is a pretty Advanced signal to learn About which is why it's not taught for
Beginners in trading once you get the Idea it's pretty straightforward but to Identify it can take a fair bit of Practice and the important Point here is To understand which time frame you were Trading on so once we get to this point That is now the second macro signal Checked off to say that we are flipping From bears to Bulls it doesn't mean that We go to all-time highs it doesn't mean That we never revisit uh prices Within These ranges where we currently are it Essentially just means that the low is Far more likely in it means that this Low here in November is all but Solidified once we get these macro Signals of course I'm thinking that this Is very likely the case at the moment But we have to get those macro signals Checked off like I said this is Something that you will not see anywhere Else on the internet because it is part Of advanced trading strategies in Particular it's again signal so if you Want to learn more about it again like I Mentioned it's through our courses here In premium so back to the signals here What price does it have to get to We want to see fifteen thousand two Hundred dollars to the upside because That is the biggest range that we had And in terms of time during that range That was about nine weeks so we had from The low to the top we are well over nine
Weeks now from the low in November we're Coming up to about five months now so We've got the time that we need the Price and the price level to reach is About thirty thousand seven hundred Ideally we want to see it Go just above That so that we at least get a nice push Past the price so a bigger move to the Upside in price Then the bear Market moved to the upside This is in log if you want to have a Look at that there you can see that it's A little more equal in this case and Linear but in log it looks like it's Already over balanced that's not the Case okay but essentially we want to get It we want to see the price get to about Thirty one thousand dollars for Bitcoin That would give us that second macro Signal and then the final signal that We're waiting for is the macro 50 level So that level comes in at forty two Thousand three hundred dollars we talked About this on the previous videos so if You aren't already subscribe to the Channel share this with a friend who is Still believing that the price could go Down to twelve or ten thousand dollars Or is in that macro bearish cam because Once these signals are met it is highly Unlikely that we will see lower prices To the cycle low these signals have Stood the test of time over 100 Years of Backed up historic data that uses these
Signals to identify Market flips of Course there are plenty other signals Out there but this one has been one of The most reliable ones that I've used Across my my career as a Trader and Investor so 42 300 is that level that We're looking for the 50 of of this Entire range here so so far we've met One we're on our way to the second Should we get to that mid 42 thousands Bam The game is on if Bitcoin is going up That typically means that the S P 500 Will also be going up there is no Decoupling going on right now on the Macro picture sure on the short term we Could see Bitcoin outpace the s p or the NASDAQ but in the macro sense it's not Decoupling yet it may in future who Knows needs maybe another 50 100 Years Of data let's just wait and see put that Aside but for now if you believe Bitcoin Is going up that means the s p also has To be strong that means the Investing space needs to be strong Because investors all flock at the same Time and everyone's still part of the Sheep and the herd so in that case then We still need to see bullish bias on the S P here is another piece of data here When it comes to a down year in the s p What happens in that first quarter Following the down year is really Important to what may happen in that
Same year going on to the end of that Year basically 2020 2 is down quarter One of 2023 was up we can see exactly How far up it was 7.03 percent call it Seven percent So when the first quarter of the Year Following that down year is up there is A very very very slim possibility of That year or the current year being a Down year that's just based on the data Going back 69 years so it's registered 49 times 20 losses that's just in all of The years not the years following a down Year so following those 20 losing years We'll analyze the performance of the s p During that first quarter of the Following year to see if it registered a Three-month gain or loss if the s p Increases during this period we'll Analyze an S P 500 performance for the Remaining nine months of the year which Is currently what we're in what happens In this next nine months if those 20 Years were losing years and then we had That up here so the chart below displays A cumulative gain achieved by holding The s p only during the last nine months If quarter one is positive after a down Calendar year and the gains are still Gains they're not huge in comparison to Cryptocurrency but it's still a gate so It's a signal that the rest of the year Will probably be up so that's only if Quarter one is up but now we get the
Good part if quarter one was greater or Equal to five percent now you can see The gains are more than doubled to what They were before this was just short of Going from a dollar to 450 so using that One dollar it goes to just above 11 if Quarter one was greater than or equal to Five percent in that first quarter and Like we just saw here quarter one of 2023 was seven percent so it was greater Than five percent so of course there's No guarantees in the market but we just Want to swing the probabilities in our Favor using the data that the market Gives to us this is given to us this is The facts not the headlines going out in The news with the latest thing that what I see this morning China's circling uh Circling Taiwan with more fighter jets And people are worried about that it's The same thing over and over again it's That cycle of news fear that continues To go around in the market and the Majority people Miss what's going on in The market just the pure data and the Facts because they're worried about the Fear that's going on out there and that You layer that on top of the banking Crisis of last month and everything else That's gone on over 2022 and you can see Why people really do wait on the Sidelines and time basically passes them By until they get into the market when They feel a lot more comfortable and
Confident which is typically at the Peaks and so if we just use this data Here quarter one showing above five Percent gains there is a strong Possibility that the rest of the year is Going to be pretty healthy from April Through to December during these years The s p enjoyed further gains in 23 out Of 26 years so it's not 100 hit rate but It's a pretty damn high probability over The course of 70 plus years so that Leads me to this tweet here if you Haven't already subscribed like and Follow me on Twitter down below because This is really a huge difference I say Here the only difference but it's a Massive difference between a wealthy Investor and a poor investor someone who Doesn't make money basically it's just How good their indicators are to Understanding the timing of the market How much do their indicators lag the Market how close can their signals and Indicators get to these lows and tell Them to getting into the market and how Close can they get out of the market Like we've talked about many times Before in the channel we're looking for October 2022 to be the low for the s p And that's come in very nicely so far Remember there is no guarantees here I Always have to get that into my head Because the market can teach even me a Lesson but for now October is holding up
Relatively nicely when everyone was Talking about this Market going into Free fall and even breaking the covered Lows back in 2020. so like I said here Eventually everyone will see the same Thing how early you're able to spot the Trend is the difference between you Making a little bit of money or no money And making a load of money thanks Again guys I hope you had a fantastic Easter I'll see you back here at the Next video don't forget those links in The top of the video description for That doubling of the BTC and of course The bit get link here as well for the Aussies to get in on this share thanks Again guys see the next one till then Peace out


